


This year, the outperformance of international equities relative to the U.S. has been well-reported. Listed real estate has been no exception. At least as measured by the public-traded firms, international property markets have been on fire.
There has been surprising dispersion amid some clear themes. Europe has been a winner, while French property firms have outperformed German ones by 20%! Brazil and Chile are off to rip-roaring starts as well. Are these results just the impact of a general rotation into international markets, or are underlying property fundamentals creating more sustainable tailwinds for international real estate?
The country returns below are dollar denominated through the end of the first quarter. Of course, the decline in USD has boosted these returns. In general, you are looking at a +5-8% currency effect. In some sense, foreign real estate is a good option if you are trying to reduce dollar exposure. For the most part, property firms collect revenue in their local currency. Conversely, a German manufacturer that exports to the U.S. will find their products less competitive as the dollar weakens. As I discussed with Dave Waters last week, foreign securities with hard asset bases act as a natural currency hedge over reasonable time periods.
REIT structures are only available in ~40 countries, so looking across REOCs (real estate operating companies) and REITs helps ascertain the whole picture.


A Distorted Snapshot of Value
At the index level, international real estate looks cheap. Reporting and structure differences make NAV and cap rate comparisons challenging. As a result, I look at price-to-book ratios to arrive at a more standardized view of relative value.
U.S. REITs currently trade around ~2.0x book value, while international real estate trades at ~0.80x book value. There is no doubt that international real estate companies trade at meaningful discounts to the U.S. REITs, but they are in line with the broader discount of international equities (~2.5x discount).
For real estate specifically, index construction and market structure skew those comparisons. In the U.S., the index is overweight tech-levered REITs like towers and data centers, pulling valuations up, while abroad, many REITs are diversified, which generally pulls their multiples down. Further, the largest developed international real estate market is Japan, where the largest REITs tend to be in the office sector. In short, the decision to rotate from domestic REITs to international ones is complicated by market structure and local nuances.
To better understand what spread actually exists, we can zoom in on a subsector. I will use multifamily as a proxy, looking at the largest operators in the U.S., Germany, and Japan: AvalonBay (AVB), Vonovia (VNA), and Advance Residence (3269). Continuing with price-to-book (specifically price-to-tangible book value), we can modify the justified price-to-book formula for REITs to use FFO instead of EPS.
As a quick review, justified price-to-book is a metric of a REIT’s returns on equity relative to what investors demand from a cost-of-equity standpoint. The numerator is the FFO over TBV minus the long-term growth rate over the implied cost of equity minus the same long-term growth rate1. If you are a finance professor about to have an aneurysm, please see the footnote.
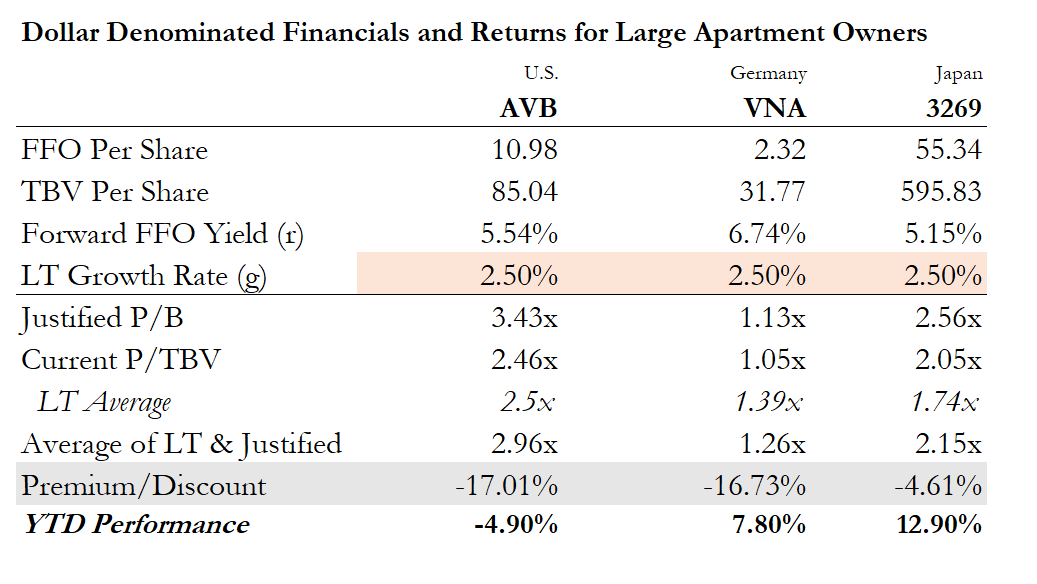
For our first look, I will set all the long-term growth outlooks to 2.5% (roughly a developed market GDP growth estimate). By this measure, Germany looks undervalued but not more than the U.S., while Japan is roughly at fair value. This view is both currency and local conditions agnostic.
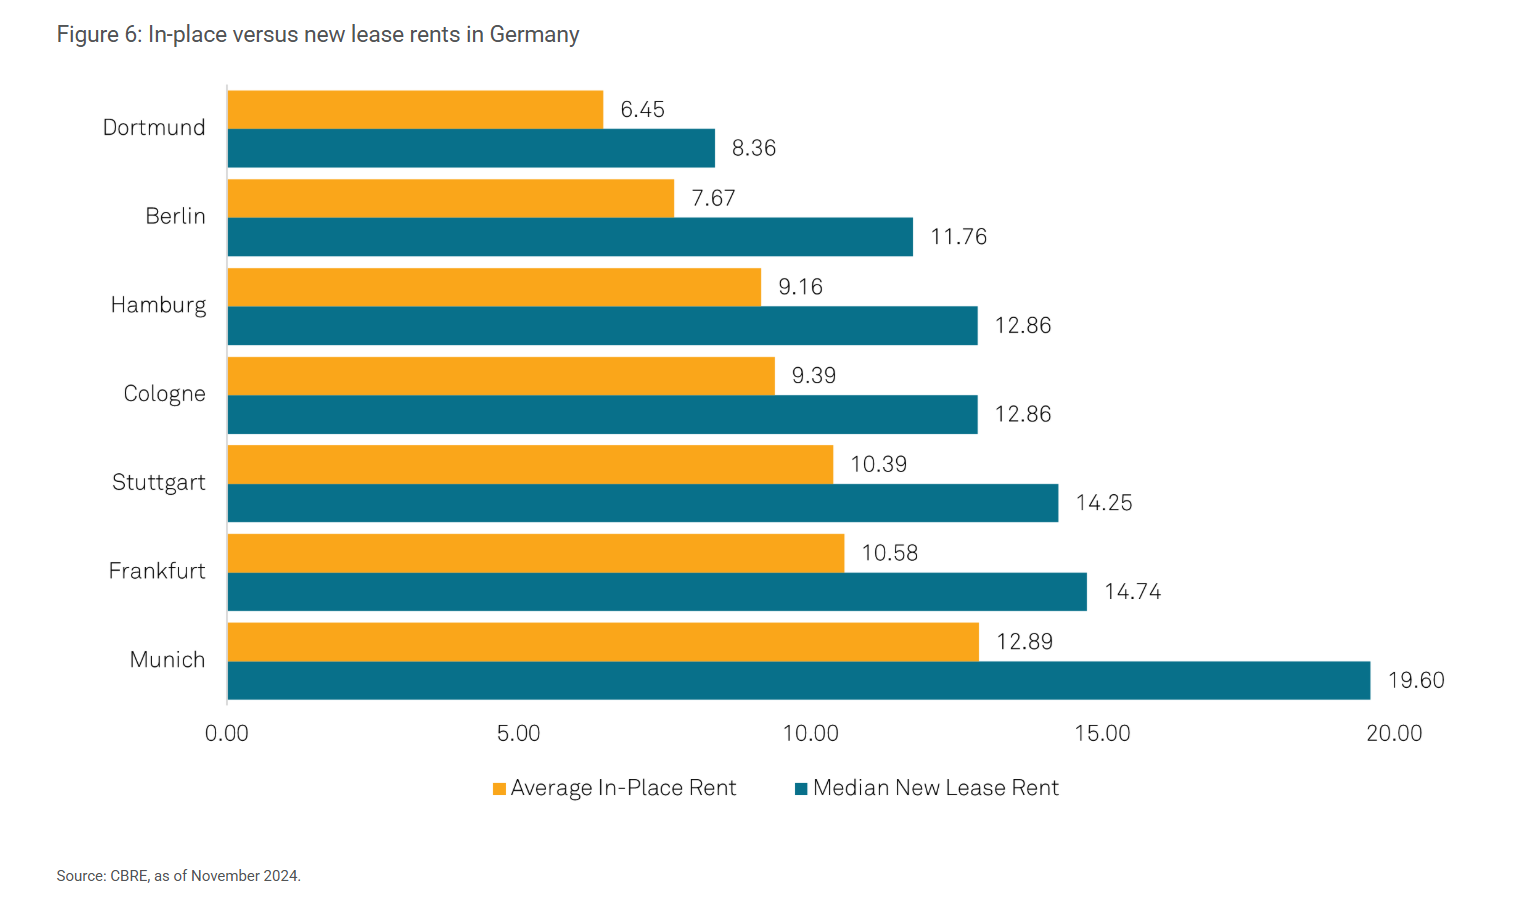
Per CenterSquare and CBRE, Germany is experiencing substantial urban rent growth. Also, keep in mind that ECB rates are expected to fall over the next year,
German residential should benefit from declining interest rates and remains attractive in a low-growth, low-inflation environment. Indications from both appraisers and the companies lead us to believe we are likely close to a trough in values. This reduces deleveraging requirements for the companies and opens the opportunity for more meaningful external growth as companies begin making acquisitions again in the coming year.
The supply and demand imbalance remains very favorable, with new completions having averaged below 300,000 units annually for over ten years against a German government target of at least 400,000. This trend is set to continue as the number of new building permits for apartments continues to fall. When combined with rent caps in place, the sector should continue to grow rents regardless of the economic environment, as a significant rent mark-to-market exists in all regions of Germany.
Meanwhile, Japan is breaking out of a decades-long malaise and is finally experiencing a modicum of inflation and wage growth. As a result, Tokyo's rent growth has begun to resemble other global gateway cities.

When we adjust our long-term growth rates up for these specific markets, including 50 basis points of currency appreciation, the relative value story begins to come together:

Interestingly, the international real estate companies above pay out less (30-40%) of FFO than their American counterparts (50-60%), so their sustainable growth rates are already slightly higher.
Whether closing an NAV discount or general multiple expansion, low starting valuations with positively revised growth are a promising set-up. Even with the recent strong performance of international real estate, there is still a disconnect between international valuations and the developing growth stories in Europe and the APAC regions.
These are not finely tuned valuations; they simply use a more standardized, forward-looking metric to better understand relative value. They also illustrate how investment returns are a function of both starting valuation and changing growth outlooks. 100-150 basis points of macro or currency tailwinds fundamentally change the relative value picture. However, as I’ll show, market structure makes re-rating a poor investment thesis.
Challenging Allocations
Perhaps uniquely, listed real estate suffers from index construction challenges. Some indices include cell towers, others do not, some include REOCs, while others limit the universe to REITs. Size and liquidity requirements restrict how expansive or narrow passive real estate products can be.
When you seek to add international exposure, all of those problems are compounded. Adding a “global” real estate ETF will still leave you overweight U.S. real estate, while ex-US Real Estate ETFs vary substantially by country and sector, which informs median market cap. As with all public investments, these minor variances leave you vulnerable to unintended factor exposures.
The three products I’ve examined - VNQI 0.00%↑ , RWX 0.00%↑ , and IFGL 0.00%↑ highlight these inconsistencies. Despite targeting similar exposure, they deliver fundamentally different investment profiles. The heavy concentration in Japan across all three funds (23-32%) represents a single-country risk that many investors may not realize they're assuming.

Similarly, the significant differences in market capitalization bias (VNQI's $5.2B median versus IFGL's $1.2B) create unintended size-factor exposure. For example, VNQI and IFGL both include Vonovia, which owns over 500,000 rental units in Germany and has a massive $23 billion market capitalization, while RWX perplexingly excludes it.
Another critical limitation is emerging market representation. VNQI includes countries like China, India, and UAE, while the others exclude them entirely. This creates not just country risk differences but fundamental differences in property rights, capital markets maturity, and currency risk profiles. These ETFs also skew sector diversification, with each product weighting property sectors differently based on their benchmark methodology.
This isn’t to say these products don’t add value. Liquidity is a challenge in many of these markets, even for larger companies. Fibra Prologis, a Mexican industrial REIT with a dollar-denominated market capitalization of more than $5 billion, trades just $6 million of daily volume on the Mexican bolsa, and the U.S. ADR has less than $50,000 of daily trading volume.
The passive ownership of Fibra Prologis in just “international real estate” exchange-traded products is nearly 4 times the average daily volume. That doesn’t account for the ownership in country-specific ETFs and other index-linked products.
Even if those limitations would not impact your ability to build a position, it means that if international real estate were suddenly of interest to larger allocators, they would all but be required to buy cap-weighted products versus being more targeted. If the Yale endowment, in their infinite wisdom, decided to move some portion of their capital from, say, private equity funds to south-of-the-border warehouses via public markets, who would be there to sell them that equity?
If you’re simply looking to capture international real estate beta, it becomes choosing a lesser evil among your options. For the longer-term investor, though, smaller names may be structurally overlooked. Moreover, those willing to express conviction in specific geographies and asset types could be rewarded for taking non-consensus views.
The prevailing view of Japan is that it is a low-growth country destined for stagnation due to its aging population. But as we saw, Tokyo is experiencing high rent growth as Japan’s nascent inflation appears to be flowing from the top down. Do changing trade patterns benefit the LATAM region, creating a larger middle class that can consume more like their developed market counterparts?
Listed real estate is a good way to express these views. Partly because they are underfollowed and partially because the residual value from all economic activity tends to accrue to real estate.
nota bene
Despite a significant democratization of financial data in the past twenty years, some of these companies still do not translate filings into English, historical data on “prosumer” research portals can be spotty, and few countries outside of the U.S. offer much in the way of shareholder engagement. This is not to suggest there is some great informational edge going unexploited in smid-cap international property companies. I am moreso flagging the difficulty and analytical creativity required to even make sense of them.
Turning Over the Global Rocks
Here are a few interesting companies worth focusing on. Not all are necessarily promising set-ups, but they are useful bellwethers for their underlying markets and sectors.
The following are all presented in local currency terms…
DEXUS (DXS)
Australia | Diversified Real Assets | AUD 7.76B Market Cap | 3.93M shares Avg Daily Volume

DEXUS dominates the Australian real asset market with an AUD 53.4 billion portfolio. Their holdings span prime office towers, industrial complexes, healthcare facilities, and infrastructure assets. DXS’s trophy development is the currently under construction Atlassian tower in Sydney. With direct ownership of AUD 14.5 billion and management of an additional AUD 38.9 billion, DXS has an embedded asset management business that can help drive its multiple.
The company is pushing forward with an AUD 15.6 billion development pipeline across multiple sectors, positioning it for significant future growth. DEXUS recently upgraded its development pipeline to AUD 16.1 billion, focusing on value-add investments in its current portfolio.
Allos SA (ALOS3)
Brazil | Shopping Centers | BRL 10.69B Market Cap | 3.86M shares Avg Daily Volume
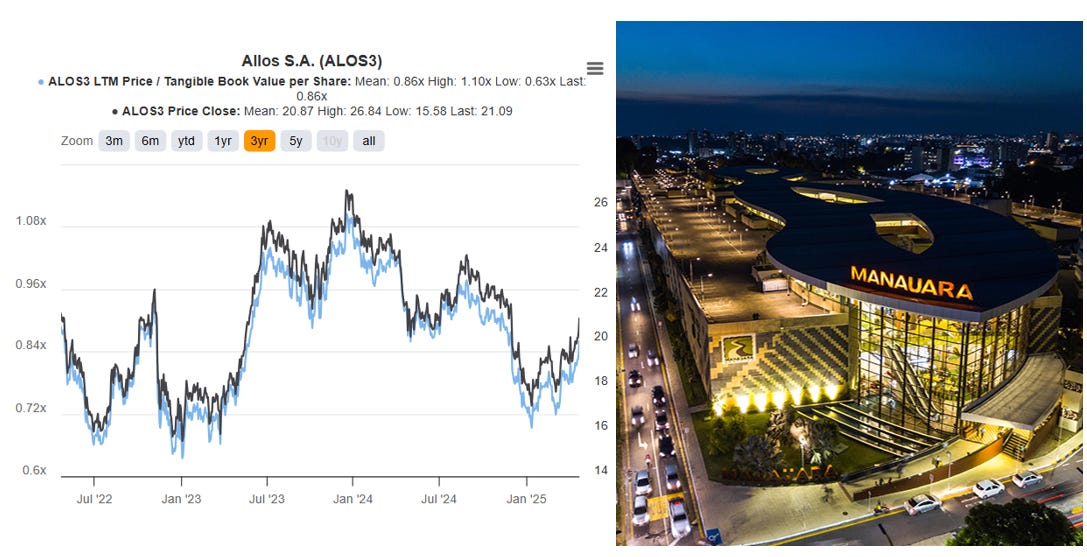
Brazilian retail powerhouse Allos operates an impressive network of shopping destinations across all five regions of the country. The company has become Brazil's dominant mall operator, formed from the 2023 merger of Aliansce Sonae and brMalls, with a portfolio of 58 malls in 40 cities.
The company is guiding for BRL 2.07-2.15 billion in EBITDA for 2025. With an enterprise value of BRL 18.4 billion, the company is trading at 8.7x EBITDA, around a 13% discount from its three-year average.
Gecina SA (GFC)
France | Office & Residential | EUR 6.93B Market Cap | 124,833 shares Avg Daily Volume
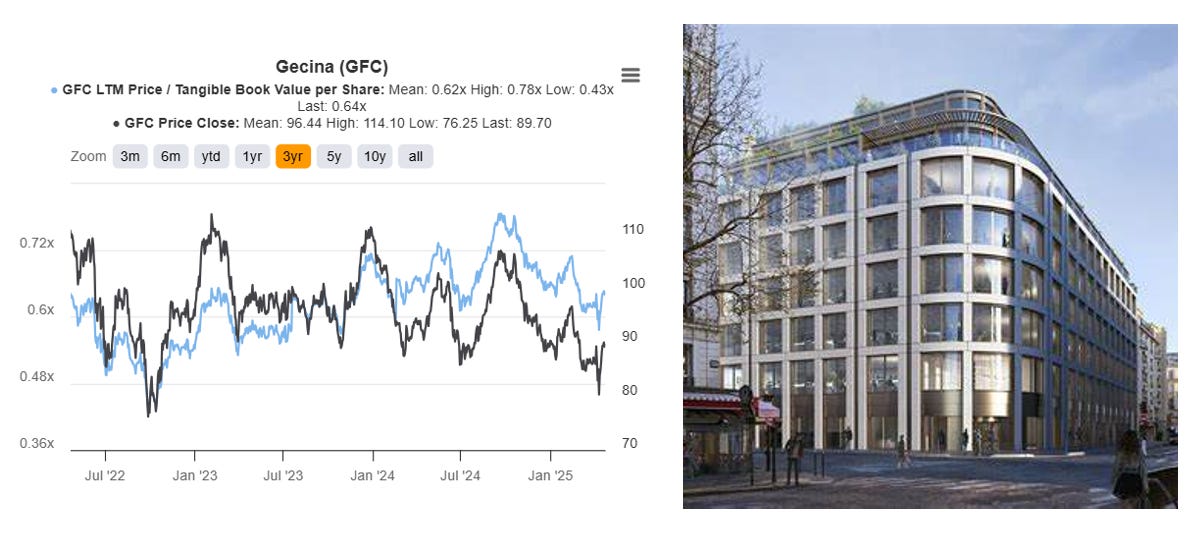
This one has the distinct benefit of saying you are a Parisian property owner. Gecina is a premier Parisian real estate operator with a EUR 17.4 billion portfolio in the city's most prestigious locations. Their holdings include 1.2 million sq.m of office space and over 9,000 residential units, with nearly three-quarters located in Paris proper or Neuilly-sur-Seine.
The company owns irreplaceable trophy assets, including buildings in the iconic Place Vendôme and the Louis Vuitton building on the Champs-Élysées.
Most recently, Gecina fully pre-let their Icône office development in Paris' Golden Triangle ahead of its H1 2025 delivery, securing a 9-year lease with Qube Research & Technologies at premium rental rates. Q1 2025 saw rental income jump 3.6% year-over-year, with a particularly strong performance from their central Paris properties.
Land Securities (LAND)
UK | Diversified REIT | GBP 4.38B Market Cap | 1.83M GBP Avg Daily Volume

Land Securities commands one of Europe's largest real estate portfolios, focusing on retail, leisure, office, and residential properties across the UK. The company has been recycling the portfolio from what it considers cyclical properties into asset classes with more defensible growth. In some ways, it is following the capital reallocation taking place in the U.S., focusing on Class A office and grocery-anchored retail parks instead of shopping centers.
Japan Hotel REIT (8985)
Japan | Hotel Properties | JPY 354.24B Market Cap | 20,121 shares Avg Daily Volume

Japan Hotel REIT Investment Corporation maintains a specialized portfolio of hospitality properties throughout Japan, spanning major urban centers and tourist destinations. Their properties range from business hotels in metropolitan cores to resorts in vacation hotspots.
A yen double whammy — you get a somewhat levered play on yen strength amid Japanese inflation. If the yen weakens, you should benefit from the uptick in foreign travel. A key attraction of hotels is the extremely short duration of “leases” and the real-time mark-to-market of rents. I actually think there may be some pull-forward here as people push to travel to Japan ahead of further yen strength.
Samhallsbyggnadsbolaget (SBB B)
Sweden | Residential & Public | SEK 11.73B Market Cap | 30.8M shares Avg Daily Volume
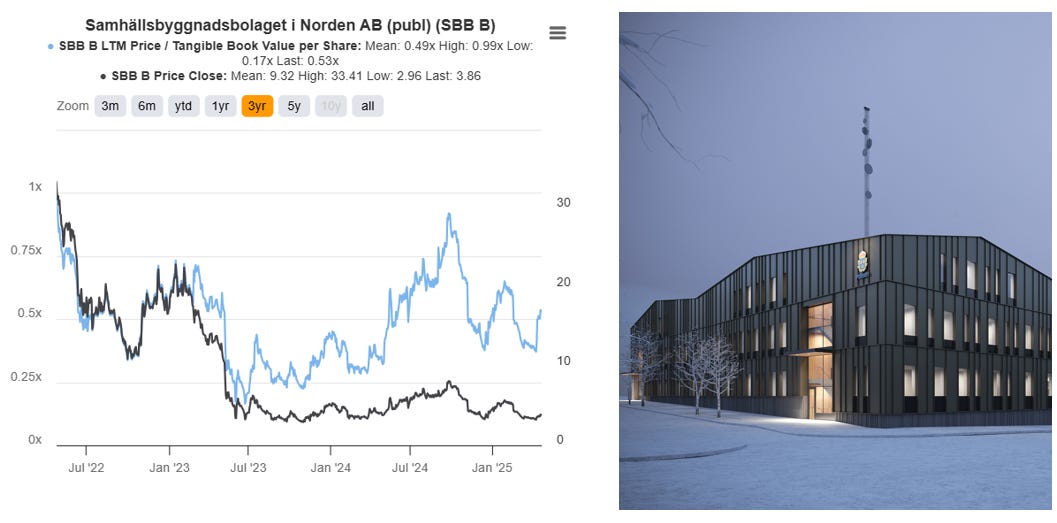
I’d include a link to the pronunciation if I thought it would help; ticker SBB is sufficient for our purposes. The company operates a diverse Swedish property portfolio across three key segments: Residential apartments and townhouses, Community properties including elderly care facilities and municipal buildings, and Education facilities ranging from preschools to universities. That diversity has not been to the company’s benefit — overlevered with expensive cost of equity the company has been in the process of spinning out its non-core units and selling off JV interests.
A large portion of SBB’s property portfolio is linked to inflation.
Elsewhere…
I wrote about the changing nature of CRE data and the implications for investors on Thesis Driven:

The odd adjustments to this formula require the kind of nerdy exploration that footnotes are made for. I have come full circle on the importance of price/book for REITs. I used to believe the complicating factors of real estate depreciation on book value made the metric mostly irrelevant to REITs.
I now think there is some important, but thus far unexplored signal, in price/book for REITs. If you run IYR through a Fama-French factor model, HML has statistical significance and a beta of .40, second only to market beta.

How does the factor perform if you adjust the metric to more accurately reflect real estate dynamics? I don’t know; perhaps an enterprising finance PhD will pick up the banner. I can say that when I looked into what was driving the results, it was REITs with high cash flow multiples trading at low price-to-book values. Their cost of equity was much lower than the cash return on equity.
How is this possible? A REIT showing high cash flow multiples but low price-to-book ratios often reflects an active rather than passive investment approach. This financial profile typically indicates a REIT engaged in significant development activities, where projects carried at cost on the balance sheet haven't yet generated their expected cash flows. It may also signal a strategic property recycling program, with the REIT selling appreciated assets and reinvesting in properties with higher growth potential but initially lower yields. Additionally, this pattern often appears during portfolio transitions when REITs are actively upgrading their asset quality or pivoting to stronger markets.
My modified justified price-to-book attempts to incorporate those factors. It suffers from some shortcomings, though. First, as a rearrangement of the Gordon Growth Model, it presumes reinvestment and yields in perpetuity — an obvious impossibility for most real estate. Secondly, the value of factors partially depends on the market using similar definitions of yield. Especially across international markets, participants look at value differently. In the U.S. Price/AFFO is standard, Japan focuses on distribution per share, while other countries lean on EBITDA. I think most listed real estate investors still discount price/book as I used to.
In my view, the benefits outweigh the drawbacks. So much REIT analysis depends on non-GAAP/IFRS metrics subject to a high degree of management judgement. Using tangible book value, gives you a grounding in a standardized balance sheet number. As a result, high/low price-to-book ratios can provide important signals about what is happening strategically.